
The Process of Data Analysis
Know Where to Start and Where to End

The Analytika is a dekadal newsletter that is delivered directly to your email. It focuses specifically on the topics of data and business analytical techniques for product managers.
When I started my career in product, fortunately, I had some exposure to managing and analyzing data. I was a researcher in atmospheric science, where I had to decipher raw satellite data to visualize the dynamics of atmospheric aerosols. Later, I worked on many transportation engineering projects to analyze the impact of new developments around the neighborhoods, digging into geographic, socio-economic, and vehicular traffic data. Although the data type and objectives were different, the key fundamental process of analyzing the data did not change.
Typically, the process starts with a goal or an objective for analysis, and it ends with presenting the findings. The end results can be presented visually as input data for another process or a summary of statistics. In this post, I will walk you through various steps involved in the process of data analysis. The following infographic outlines the steps which I will be discussing below.

Let’s start with:
1. Goal
To perform data analysis, the very first thing you need to have is a “goal.” This is the why behind your analysis. Generally, we collect data to understand various aspects of a system which is difficult to understand through qualitative methods. So, you may want to see the trend in the monthly recurring revenues, or you may want to check the trend in new user registrations for your product. Begin your analysis with a clear goal and add the extra elements to it, such as:
Scope - set boundaries and stay focused to achieve the goal
Plan - define the type of analysis, type of data to collect, method, resource, and financial aspects of data collection, storage options, etc.,
Assumptions - know your assumptions to understand the dependency or constraints of end results.
Scenarios - Setup scenarios with variable conditions or assumptions
Ultimately, having a goal will help you easily navigate through the analytical process and exit with answers in the end.
2. Data Collection
Once you identify the goal, the next step in the process is finding the data to use or collecting it if the data is not available. Depending on the goal of your analysis, you can collect two types of data.
Qualitative Data
Quantitative Data
If you wonder what these data types mean, please refer to my previous post on Data and Data Analytics. Since Qualitative data deals with quality and is descriptive rather than numerical in nature, it is collected manually. On the other hand, Quantitative Data is collected both manually and automatically using machines because the data is numeric in nature, and it deals with quantity.
Fundamentally, the data is simply the collection of data points describing a quality or quantity of an object. Every data point carries at least one of 3 key pieces of information.
Object identification (ID)
Time (timestamp)
Location (lat/lon)
Overall, data points make the building blocks of the data that is collected either by physical activity, instruments, or by an automated process. Data collection is not a simple task. You should follow a proper process to acquire reliable data. When we collected data for analysis, we went through the below steps.

Remember! to perform data analysis, not every time you have to undergo the process of data collection. These days, most of the data you need is readily available. It is collected by someone, somewhere, and stored in a format that is easy for you to download and analyze. The comfort of using such data depends on the format it is saved. That’s another concept. Now, let’s look at the next step in the data analysis after you have the data.
3. Data Preparation
The raw data you collected in the previous step is not yet ready for analysis. Sometimes, you may want to exclude the data of a certain time period, certain location, or particular object. Breaking down the data will simplify the analysis process and finish it quickly. If I have raw data, I always do the following before I start working on the data.
Organize: Create a folder for the analysis and create 2 sub-folders — one to keep the raw data and another to keep a duplicate of the raw data to work with.
Reduce Data: In most cases, not every data and data point would be required for your analysis. Eliminate the data that you don’t need. Keep it simple. It is also generally referred to as filtering data or funneling.
Join or Split data: Sometimes, you may need to split to look at the data from different angles (some call this “segmentation”) or join data if kept in different tables to get a consolidated view. Move the data as per the need.
Validate: Some of the data points may have null values or gibberish data that would lead to problems in analysis. Identify them and eliminate or validate them.
In sum, data preparation is a crucial step before you get into data modeling, which we will discuss next.
6. Data Modeling
This step is required only when you need to connect to the other data sources to fetch the related data. Let’s look at what’s data modeling and why it is important.
As per Wikipedia definition, Data Modeling is the process of creating a data model for an information system applying some formal techniques. As I previously mentioned, we collect data to understand various aspects of a system. When systems are large, the data will be broken down into various entities or representations of the system. Analyzing such data requires additional measures, such as creating a visual representation of how data communicate to each other. It is important to illustrate the types of data used and stored within the system, how they relate to each other.
When I have large data to analyze for a system, I generally follow the below steps to model the data.
Identify the entities - figure out what things, events, or concepts are represented in the data set.
Identify key properties - look at the unique properties of each entity.
Identify relationships - map out the relationships between the entities.
Validate and finalize - repeat the above process by validating the relationships and finalize the model
Again, this step is not necessary if you have all the data you need to analyze and there is no dependency on other data. If you would like to learn more about data modeling, check this post here. Now, let’s look at the analysis step.
6. Analysis
Well, this is where your analytical skills begin to play a role. You have all the data you need. Now it is time to dig deep into the data and uncover the message out of it. In my previous post, I gave a little bit of an intro to the type of analytics you can perform to evaluate data. In this Analysis step, you perform the following analytics based on your goal of the analysis.
Descriptive Analytics
Diagnostic Analytics
Predictive Analytics
Prescriptive Analytics
In my experience, I performed mainly descriptive, diagnostic, and predictive types of analytics. Prescriptive analytics uses extremely complex data, and it is done with the help of advanced technologies such as artificial intelligence, machine learning, and neural networks. Alright! Once you have some statistics and basic charts, the next step is visualization. Although basic charts could help you understand to an extent, these days, creating a better visualization is the key. Some people call them ‘viz’ or ‘vizzes.’
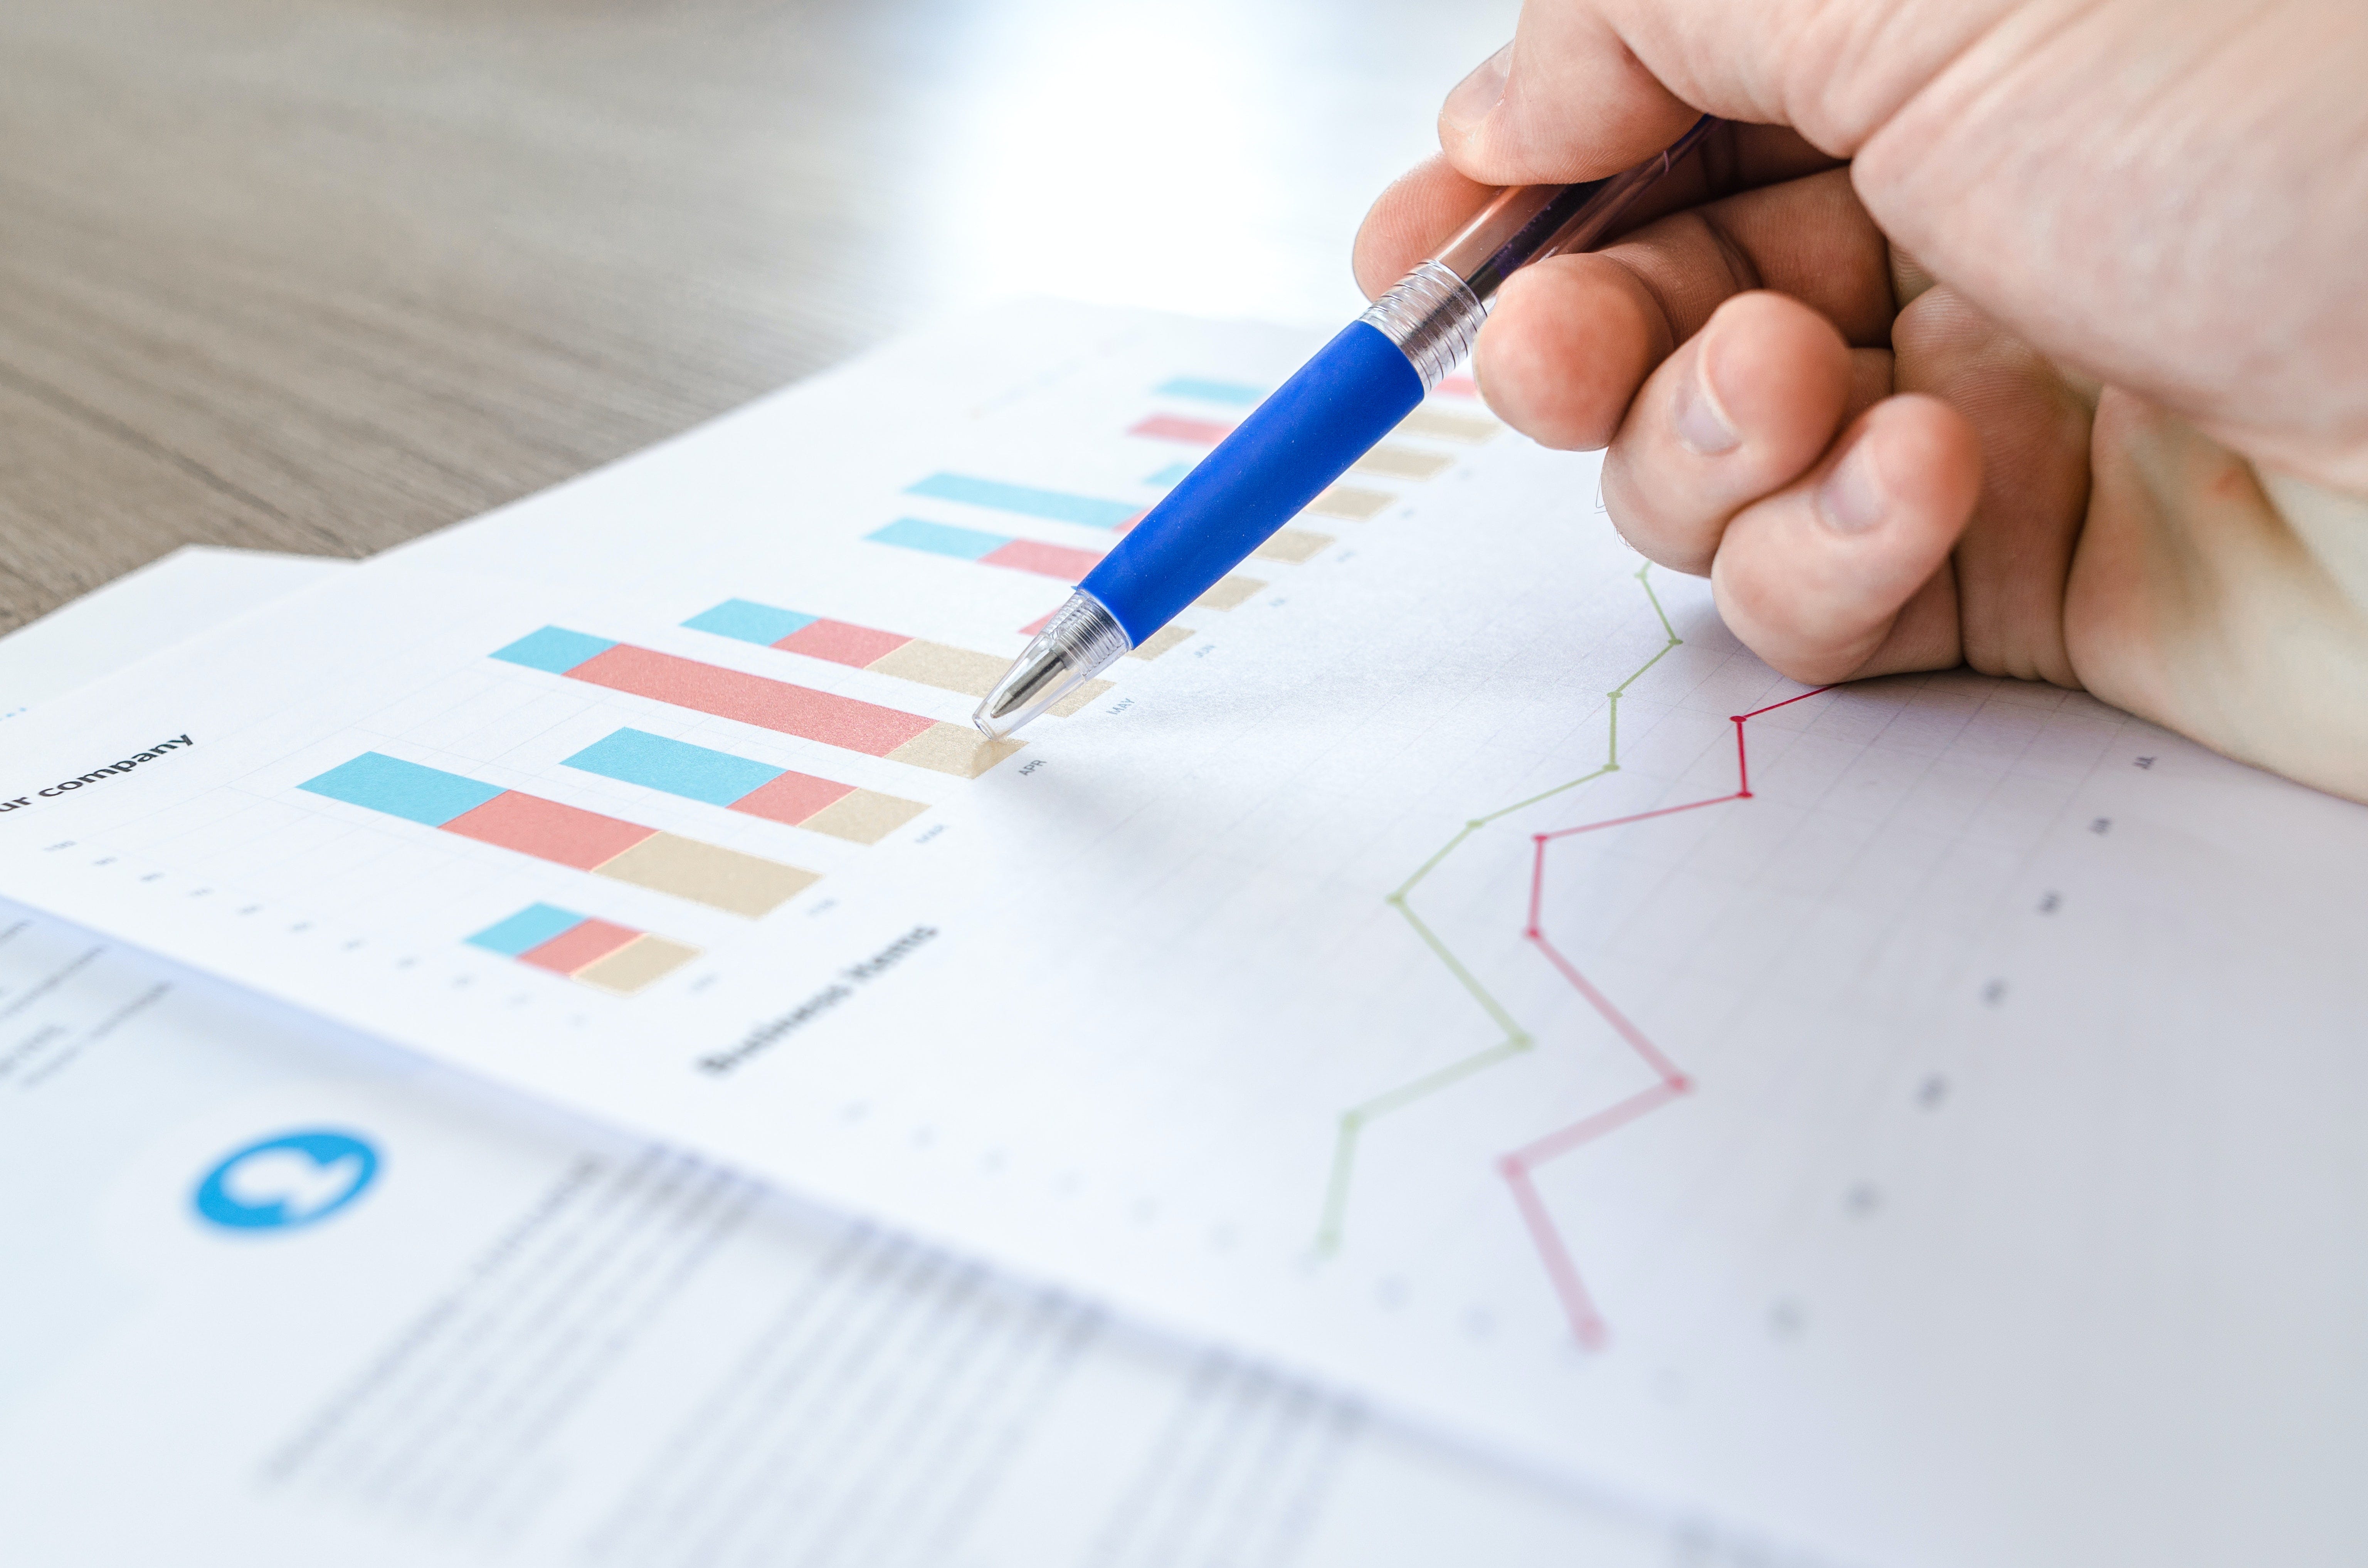
6. Visualization
Any charts and tables that you prepare in the previous step are part of the visualization. Vizzes tell you the story, give you hints on why something happened or what you can expect in the future. Preparing a visualization is an art and science. I was not good at it until I took this course on Udemy by Toan Hong. Toan has a dedicated website as well, called Tableau Magic, where he writes about creating a visualization. I highly recommend you check that out.
Below are the most common visualizations used by most analysts:
Lin/Scatter Plots
Bar Charts
Pie Charts
Histograms
Maps
And, some experts use advanced visualization techniques such as:
Bubble Cloud
Heat Map
Donut Chart
Sankey Diagram
Progress Bars
Treemaps
Sunburst diagram
Word Cloud
Onion Chart
Use advanced visualization techniques only when common visualizations do not help much in conveying the message. Sometimes, a simple bar chat can do well presenting temporal data or a histogram to show a normal distribution of data. So, choosing a good viz is also a key.
Revisit the goal of the analysis and ensure that you have completely addressed the WHY behind the analysis. Tweak your assumptions and see what happens. Ultimately, I recommend you have a visualization for every scenario and ready to be documented for presentation to your stakeholders. Last but not least, documentation is another step that you can’t miss.
6. Documentation
When it comes to documentation, everyone thinks it is a painful process of writing that no one reads. Well, documentation is not always about writing a report or piece of blog. It can also mean preparing a convincing video, a story using relevant infographics, or a simple slideshow for your presentation. To document the findings, scientists publish their work in journal articles; some prefer a quick poster presentation in conferences, and some prefer to present things in their blog articles. See what fits well to present your case.
Summary
Alright, I hope this has been a good source of information for those who are stepping into data analysis and wondering where to start. In summary, the fundamental process for data analysis remains the same regardless of the data and objectives. However, I did not go in-depth as far as data modeling and different types of analytics are concerned. The process of data analysis becomes vast as you get deeper and deeper in these areas. For more reading, visit the links below in the reference section.
Thanks for reading!
References
I couldn’t have written this post without reading the following resources. I highly recommend you to visit the below link to get them for more information about this topic.
The Analytika is a dekadal newsletter that is delivered directly to your email. It focuses specifically on the topics of data and business analytical techniques for product managers.